
Thread Transfer
The Friday Report Problem: Why SMB Ops Reporting Is Always a Week Late
The report is accurate and describes a world that stopped existing on Tuesday. Fix capture first, then reconciliation, then presentation — and ask what happens automatically when a number goes the wrong way.
Thread Transfer
Operations Systems for SMBs
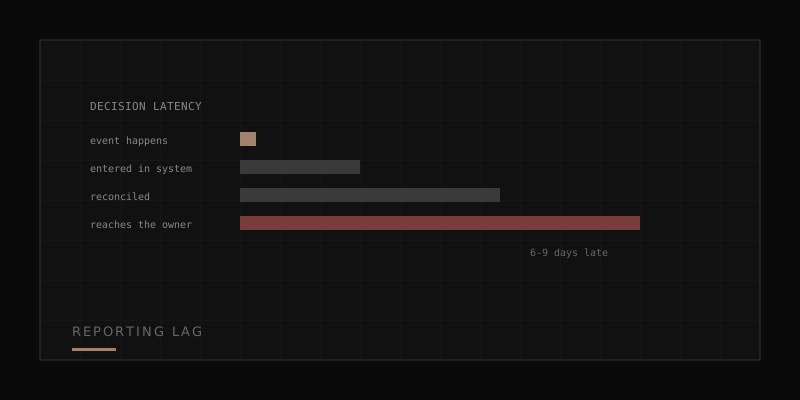
Every small business has a version of the Friday report. Someone spends half a day pulling numbers from four systems into a spreadsheet, emails it round, and everyone nods. The report is accurate. It is also describing a world that stopped existing on Tuesday, and the decisions it informs are being made on Monday — which means the business is steering with a nine-day-old picture and calling it data-driven.
Reporting lag is not a reporting problem. It is a decision-quality problem, and it is one of the few operational defects that gets steadily worse as a business grows, because every new system, channel, or location adds another source that must be manually reconciled before anyone can see anything.
Where the Lag Actually Comes From
Owners assume the delay is in producing the report. It usually is not. The report takes four hours. The lag is upstream, and it accumulates across four stages.
| Stage | Typical delay | Cause |
|---|---|---|
| Event happens to event recorded | 0-3 days | Paper, batch entry, end-of-week timesheets |
| Recorded to reconciled | 1-4 days | Systems disagree; someone resolves manually |
| Reconciled to reported | 1-2 days | Report is assembled by hand on a schedule |
| Reported to decided | 1-3 days | Report lands after the meeting it was needed for |
Total: six to twelve days between something happening and anyone acting on it. Speeding up the report itself attacks the smallest of the four stages, which is why buying a BI tool so often produces a beautiful dashboard displaying week-old data faster.
The Cost of Deciding Late
Decision latency has no line on the P&L, which is why it survives. It shows up as a series of events that each get attributed to something else.
- A job going over runs to completion. Caught on day four it is a conversation. Caught at month-end it is a write-off.
- A stock-out is discovered by a customer. The reorder signal existed in the data six days before anyone looked.
- A supplier price rise propagates unnoticed. Quotes go out at old costs for a month before anyone reconciles.
- An underperforming channel keeps getting spend. Weekly reporting means four wasted weeks before a trend is even visible.
- A quality issue ships repeatedly. Complaints are logged in one place and production in another; the correlation is only visible in a report nobody builds.
Each incident gets a local explanation — a bad job, a supplier issue, a difficult customer. The common cause is that the information existed and arrived too late to matter.
Why Adding a BI Tool Rarely Fixes It
The instinct is to buy a dashboard. Sometimes that works. It fails when any of these are true, and in small businesses at least one usually is.
The data has no single definition
The CRM's "closed won" and accounting's "invoiced" and operations' "delivered" are three different events describing one sale. A dashboard pointed at all three produces three numbers and an argument. Visualisation cannot resolve a definition conflict; it just renders it in colour.
Reconciliation is a human judgement
If producing a correct figure currently requires someone who knows that these two records are duplicates and that customer is always coded wrongly, then automating the pull automates the errors too. The judgement has to be encoded as a rule before it can be removed from a person.
The underlying capture is late
A dashboard cannot show what has not been entered. If time is captured on Friday for the whole week, no tool can give you Tuesday's picture on Tuesday. Latency is bounded by capture, and capture is bounded by how easy it is to record something at the moment it happens.
The metric is not owned
Dashboards nobody owns become wallpaper within a month. Every number needs a name attached and a defined response when it moves.
Fixing Capture First
Reporting lag is always attacked in the wrong order. The correct order is capture, then reconciliation, then presentation. Presentation is the last and easiest step, and it is where almost everyone starts.
Capture improves when recording an event becomes easier than not recording it:
- Record at the point of action, on the device present. A phone in the van, a tablet at the machine, a scanner in the aisle. Not a desktop form completed later.
- Fifteen seconds maximum. Past that, people batch it up, and batched data is remembered data, which is wrong data.
- Structured, not free text. A job number and an operation code beat a note that requires interpretation.
- One action, one entry. If issuing material requires updating stock and the job separately, one of them will be skipped.
- Immediate visible consequence. People who see their entry change something on a screen keep entering it. People filling a void stop.
Get capture to the same day and reporting lag collapses from nine days to two before you touch a single dashboard.
Encoding Reconciliation
The second stage is the reconciliation someone does in their head every week. Extracting it is unglamorous and high-value.
Sit with whoever builds the report and record, literally, every judgement they make: which system wins when two disagree, which records are excluded and why, how a customer is matched across systems, what an unmapped code means. That list is your rule set. It is usually shorter than expected — fifteen to thirty rules covers most small businesses — and once written it can be automated, tested, and, critically, argued about openly rather than living in one person's head as the single point of failure it currently is.
This is the actual content of a working operations layer. Not charts: an agreed definition of every number and the rules that produce it. Charts are what you put on top once the definitions exist. A live operations dashboard built this way reports continuously because the reconciliation runs continuously, rather than waiting for a person with a spreadsheet and a free afternoon.
What to Report, and How Often
Frequency should match how fast a number can actually change and how fast you can respond. Reporting a slow-moving metric daily produces noise; reporting a fast-moving one monthly produces regret.
| Metric | Cadence | Because |
|---|---|---|
| Open job margin variance | Daily | Actionable while the job is live |
| Stock below reorder point | Daily | Lead times make a day expensive |
| Orders past promised despatch | Daily | Service recovery is time-sensitive |
| Approvals ageing past 48h | Daily | Blocks other work |
| Delivered but not invoiced | Weekly | Directly recovers cash |
| Pick accuracy | Weekly | Needs volume to be meaningful |
| Margin by customer | Monthly | Slow-moving, strategic |
| Supplier price drift | Monthly | Slow-moving, compounding |
The daily rows share a property: each has a defined response. Something is past due, so someone contacts the customer. Approvals are ageing, so they escalate. A metric with no defined response does not belong on a daily report regardless of how interesting it is.
The Test
One question reveals whether your reporting is operational or ceremonial: when the number goes the wrong way, what happens automatically?
If the answer is "we discuss it at the next meeting," the report is ceremony. If it is "an exception appears on a named person's queue with a due date," it is a control. The difference is not the quality of the chart. It is whether the number is connected to a workflow.
Most small businesses have ceremony and believe they have controls, which is why the same problems recur after being thoroughly discussed. Discussion is not a mechanism.
A Practical First Step
Take your current weekly report. For every number on it, write down two things: how old the underlying data is when the report is issued, and what happens when the number is bad. Most reports will have one or two rows where both answers are good, and a majority where the data is over five days old and the response is "we talk about it."
Delete the ceremonial rows. For the two or three that matter, work backwards to the capture point and shorten it. That single exercise usually moves more than a year of dashboard projects — and it costs an hour.
If the honest answer is that nearly every number is late and nothing happens automatically, the constraint is structural rather than analytical. The Operations Leak Audit at opsmavix.com maps exactly that: where information is generated, where it stalls, and which two or three loops are worth closing first. Ninety minutes, written findings, no pitch deck.
Learn more: How it works · Why bundles beat raw thread history