
Thread Transfer
How to Reduce Cost Per Application While Increasing Lead Volume
Lower CPA and more leads aren't opposite directions. They're opposite symptoms of the same broken funnel. The 30-day playbook to move both.
Thread Transfer
AI Systems for Builders
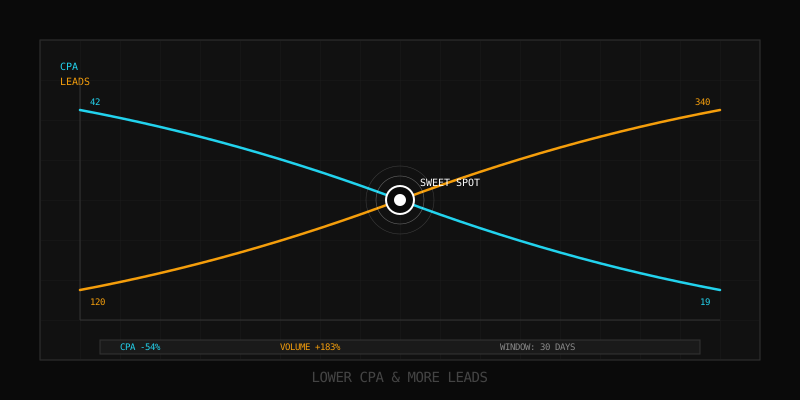
Most marketers think lower CPA and higher lead volume pull in opposite directions. Push for more leads, CPA climbs. Push CPA down, volume collapses. So they pick a side, optimize for it, and accept the tradeoff like it's physics.
It isn't. Lower CPA and more leads aren't opposite directions. They're opposite symptoms of the same broken funnel. When you fix the underlying cause, both numbers move at the same time. We've watched accounts cut cost-per-application from €42 to €19 while simultaneously tripling weekly lead volume. Nothing about that violates auction math. It just requires diagnosing the funnel correctly before touching the bid strategy.
Why CPA Usually Rises With Volume (And When It Doesn't)
The conventional wisdom isn't wrong, it's incomplete. CPA tends to rise with volume because of three real mechanics:
- Audience depth runs out. Your highest-intent prospects convert first. The next tranche is colder.
- Auction prices climb. Bidding into a smaller pool of qualified users means competing harder for each impression.
- Creative fatigues faster. Higher spend means more frequency, which kills CTR, which raises CPM, which raises CPA.
Those mechanics are real. They're also defeatable. The CPA-volume tradeoff only holds when you're scaling inside a fixed funnel. The moment you widen the funnel's throat or fix its leaks, the curve flattens. In some cases it inverts: more volume, lower CPA, for weeks at a time.
Here's the data shape we typically see when an account is genuinely stuck in the tradeoff vs. when it's stuck because the funnel is broken:
| Symptom | Real Tradeoff | Broken Funnel |
|---|---|---|
| CPA climbs with volume | Linear, predictable | Step-function, sudden |
| Frequency | 2.5-3.5 weekly | 5+ weekly on top creatives |
| Form completion rate | Stable as spend rises | Drops 20-40% as spend rises |
| Lead-to-SQL rate | Stable | Collapses past a threshold |
| CTR by placement | Uniform decline | Specific placements crater |
Before you accept that CPA must rise, run those five checks. If three or more match the "Broken Funnel" column, you're not in a tradeoff, you're in a leak. Patching the leak is how you get both metrics moving the right way.
Funnel Diagnosis: Top-of-Funnel vs Bottom-of-Funnel Waste
Every lead-gen funnel has two failure modes, and they require opposite fixes. Diagnose which one you have before changing anything.
Top-of-Funnel Waste
TOF waste means you're paying to reach the wrong people. Symptoms: CTR under 1%, low frequency, broad audiences underperforming interest stacks, high CPM relative to vertical benchmark. The leads that do come through often look fine on the form but never close. SQL rate sits under 15%.
Fix TOF waste with sharper targeting signals, not narrower audiences. Counter-intuitively, broad audiences with strong creative signals usually outperform 500K interest stacks for lead-gen. The creative becomes the filter. See our broad targeting breakdown for the mechanics of letting the algorithm do qualification work that interest layers used to do.
Bottom-of-Funnel Waste
BOF waste means you're reaching the right people and losing them on the page. Symptoms: 2%+ CTR, healthy CPC, but form completion under 30%, or completion rate that drops 15%+ between mobile and desktop, or a 50%+ bounce on the LP. The leads that complete are usually decent, but you're getting one for every five clicks instead of one for every two.
Fix BOF waste with form length surgery, friction removal, and pre-frame copy that re-sells the click. A cost-per-application drop from €42 to €28 from form work alone is normal. We've seen bigger.
The diagnosis matters because applying the wrong fix actively hurts you. Tightening audiences when the problem is the form just starves the algorithm. Shortening the form when the problem is bad targeting just cheapens already-junk leads.
Bid + Budget Structure for Joint Optimization
Most accounts run cost-cap or lowest-cost with a single CBO and 4-6 ad sets. That structure is fine for steady-state, but it creates a CPA-volume tradeoff by design. The algorithm has to pick: spend the budget cheaply (low CPA, low volume) or stretch into more expensive auctions (high CPA, more volume). You can't get both inside one ad set.
The fix is structural. Split the goals across separate ad sets with different bid signals, so each one is optimizing for one objective at a time. A working structure looks like this:
| Ad Set | Bid Strategy | Budget Share | Role |
|---|---|---|---|
| Efficiency core | Cost cap at target CPA | 40% | Anchor CPA, capture cheap conversions |
| Volume scale | Lowest cost, no cap | 35% | Push lead count, accept higher CPA |
| Lookalike test | Cost cap at 1.2x target | 15% | Find net-new pools at acceptable CPA |
| Retargeting | Lowest cost, capped frequency | 10% | Recover form abandoners |
Two things matter here. First, the efficiency core acts as your CPA anchor: as long as it's hitting target, the blended CPA stays controlled even when the volume ad set runs hotter. Second, the volume ad set is explicitly allowed to be more expensive per lead, because it's pulling in incremental conversions you wouldn't get otherwise. Blended CPA stays below target, total leads climb.
Run this for 14 days before judging it. The cost-cap ad sets need a learning phase, and Meta will deliberately underspend them at first while it figures out who fits the cap.
Creative Refresh Cadence That Compounds
Creative is the single biggest lever on both CPA and volume, and it's the lever almost everyone underuses. Most accounts ship a new creative when the existing one breaks. That's already too late. By the time frequency hits 5 and CTR drops 30%, your CPA has already climbed 40% and you've burned two weeks of margin.
The right cadence is preemptive. Ship a new creative variant every 7-10 days into the same ad set, let it fight for delivery, and kill the worst performer once you have a clear winner. This keeps frequency low and gives the algorithm fresh fuel to optimize against.
A working production rhythm:
- Day 0: Launch 4 creative variants in the volume ad set.
- Day 7: Kill the bottom 2 by CPA, ship 2 new variants.
- Day 14: Repeat. Promote any single variant beating CPA target by 20%+ into the efficiency core.
- Day 21: Re-shoot the winning angle in a new format (UGC, static, motion graphic) to extend its life.
Watch the frequency metric obsessively. The trigger to refresh isn't "the creative is tired," it's "frequency crossed 3.5 this week." If you wait for performance to visibly decay, you've already paid the tax. Creative fatigue detection goes into the specific thresholds we use across verticals.
One more thing on creative: variant != iteration. Four different headlines on the same image is one creative. Four different angles (problem-aware, solution-aware, social proof, founder-story) is four creatives. The algorithm rewards angle diversity, not micro-tweaks.
Audience Expansion Without Quality Collapse
Expanding audiences without dropping lead quality is the move most teams get wrong. They either expand too fast (broad + lookalike 1-10% + interest stack, all at once) and watch quality crater, or they refuse to expand and stay stuck.
The disciplined version is sequential. Add one expansion vector at a time, hold it for 14 days, measure lead-to-SQL rate (not lead volume), and only keep the expansion if SQL rate stays within 15% of baseline.
Expansion order that tends to work:
- Lookalike 1% of converters: Highest quality net-new pool. Should match baseline SQL rate within 5%.
- Lookalike 1-3% of converters: Looser, more volume. Expect 10-15% SQL rate decline.
- Broad with Advantage+: Algorithm finds patterns interests miss. Quality often equal or better.
- Lookalike of high-value customers (LTV): Slower to fill, but better economics over time.
- Geographic expansion: Adjacent metros first, then adjacent countries with language parity.
The mistake is judging expansion by CPA alone. A lookalike 1-5% might deliver leads at the same CPA as your baseline, but if SQL rate halves, your true cost-per-customer doubled. CPA is a proxy. Cost-per-qualified-lead is the metric. CPA optimization in depth covers the full attribution chain.
For accounts in regulated verticals (finance, education, health), add a quality guardrail: kill any audience whose lead-to-SQL rate falls below 60% of your account baseline within 7 days. No exceptions. Bad leads in regulated funnels poison the optimization signal and you'll feel it for weeks.
The Page Itself: Don't Skip the LP
You can win the auction and still lose the conversion. The landing page is where most of the CPA leak actually lives, but it's the last place most marketers look because it's outside the ad platform.
Three LP fixes that move CPA noticeably:
- Mobile-first form rebuild. 70%+ of lead-gen traffic is mobile. If your form has more than 5 fields above the fold on a 375px viewport, you're losing 30%+ of intent.
- Pre-frame copy. The 200-400 words above the form aren't decoration. They re-sell the click, reduce buyer's remorse before it forms, and lift completion 15-25%.
- Friction audit. Phone number required? Address? Date of birth? Each field over the necessary minimum costs you 5-12% completion. Cut to the bone, enrich later.
For deeper LP mechanics specific to Meta traffic, the Meta lead-gen guide walks through the full ad-to-LP-to-CRM chain.
30-Day Playbook: Order of Operations
Knowing the levers is useless without sequence. Pull them in the wrong order and you'll add noise that masks signal. Pull them in order and each move makes the next move easier to evaluate.
Week 1: Diagnose, Don't Touch
- Pull 30 days of data. Calculate CTR, frequency, form completion rate, lead-to-SQL rate by ad set.
- Identify whether you're TOF-leaking or BOF-leaking. Don't guess.
- Audit creative roster: how many are running, what's their frequency, what angles do they cover.
- Do not change bid strategy, budget, or audiences this week. You're measuring baseline.
Week 2: Structural Fixes
- Restructure ad sets into the 4-set efficiency/volume/lookalike/retargeting model.
- Apply the dominant leak fix: shorten form (BOF) or broaden audience (TOF).
- Ship 4 new creative variants covering angle diversity, not headline tweaks.
- Set frequency cap at 3 weekly on retargeting, no cap on prospecting.
Week 3: Hold and Read
- Resist all changes. Learning phase needs 7+ days minimum.
- Daily metric check, weekly action. Look for the efficiency core hitting CPA target.
- Kill the bottom 2 creatives by CPA at day 14, ship 2 replacements.
- Expect a CPA spike in days 1-4 followed by stabilization. Don't panic.
Week 4: Expand Cautiously
- If efficiency core is hitting target, add one expansion vector (lookalike 1-3% or broad).
- Increase volume ad set budget 20%, hold efficiency core flat.
- Refresh creative roster again. Promote any 20%-beating variant into efficiency core.
- Re-measure blended CPA and lead volume vs week 1 baseline.
A typical outcome over this 30 days, in an account that wasn't broken to begin with: blended CPA down 20-35%, weekly lead volume up 40-80%. In an account with a real leak (bad form, ancient creative, audience stack too narrow), the numbers move harder, often 50%+ on both axes.
What Breaks This Playbook
Honest version: this doesn't always work. Three conditions where the CPA-volume tradeoff is real and unbreakable in 30 days:
- Total addressable audience too small. If your serviceable Meta audience is under 200K, you'll exhaust it fast. Expansion past the natural pool just buys junk.
- Offer-market fit problem. No amount of creative iteration fixes an offer the market doesn't want. CPA stays high because the offer is the bottleneck.
- Pixel data poisoned. If you've been optimizing for the wrong event (page view, not lead), the algorithm has learned the wrong pattern. Fix the event, re-train for 2 weeks before judging.
Diagnose those first. If any of them apply, structural ad changes are the wrong starting move; offer or product is.
Key Takeaways
- Lower CPA and higher lead volume are not opposites when the funnel works. They're co-symptoms.
- Diagnose TOF vs BOF leak before changing bids or audiences. Wrong fix actively hurts.
- Split goals across ad sets: efficiency core anchors CPA, volume ad set pushes leads.
- Refresh creative on a 7-10 day cadence, before frequency hits 3.5. Angle diversity over headline tweaks.
- Expand audiences sequentially, measure lead-to-SQL not just lead volume.
- Don't ignore the LP. Form length and pre-frame copy move CPA more than bid strategy in most accounts.
- Run the 30-day sequence in order. Diagnose, restructure, hold, expand. No shortcuts.
Learn more: How it works · Why bundles beat raw thread history